While Leakalyzer tests that show water loss are extremely valuable for more efficiently locating leaks, using the Leakalyzer to identify when no water loss is happening is just as valuable. One of the biggest wastes of time for a leak detector is trying to find a leak that doesn’t exist. But, leaks aren’t the only factors that cause a change in water level, and homeowners can be quick to call for help without considering the other factors that may be at play. In these situations the Leakalyzer can help confirm if in fact the pool is leaking before starting work. Or, once a leak has been found and repaired, a no water loss test can confirm that your repair is holding and that no other leaks are present.
Even though it seems like reading these tests should be straight forward, the Leakalyzer is so sensitive that minuscule changes in water level that are smoothed out during a water loss test show up more significantly on a no water loss test, making the trend harder to identify. The spikes that show up on the graph in these situations don’t mean it’s a bad test, they just show that the Leakalyzer is being extremely accurate. Because of the movement in pools, the water level is constantly going up and down slightly. Remember, the Leakalyzer is able to measure water level changes down to the 10,000th of an inch (the size of a red blood cell!), so you’ll see these tiny changes on your graph.
When looking at the graph, the ability to identify trends is the key to effective use and interpretation. You’re trying to look past the up and down spikes to identify if as a whole they are trending flat or downward. For instance, if you are 10 or 15 minutes into the test and still consistently spiking on either side of zero or the evaporation mark it is most likely a no water loss situation. However, if the test is going up and down but both the highs and the lows are consistently getting lower there is most likely a leak.
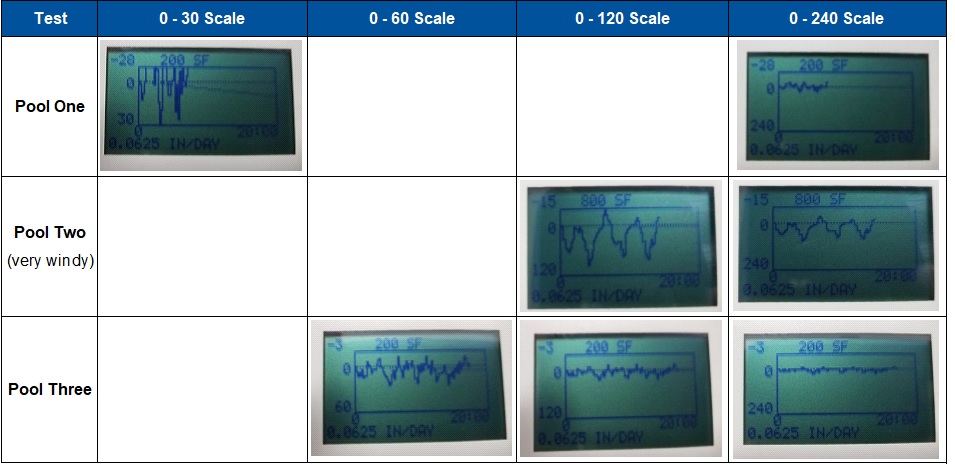
Another aspect to watch is the scale of the graph. The scale automatically adjusts based on the measurements that the Leakalyzer is recording. Sometimes when the pool isn’t losing water, the ups and downs on the graph can look drastic, but the scale of the graph is still at 0 to 30. This makes for very dramatic spikes with very little actual change in the water level. Zooming out to a 120 or 240 scale causes those spikes to look more realistic, and will help identify a flat line trend. Remember, a measurement of 100 on the scale is only equal to the thickness of a sheet of paper! Take a look at the below graphs to understand how the scale affects no water loss tests.